Kilcullen Science and Engineering

Showing posts with label hydrometrics. Show all posts

Friday, October 09, 2026

ESB Report on Rainfall Management

Graph of water level
Water level in the Poulaphouca Reservoir. Graph courtesy ESB.

Water level in the Poulaphouca Reservoir is now at 183.68 mOD, roughly midway between the upper and lower operating levels of 186.30 mOD and 179.90 mOD respectively. According to the Wicklow County Council-commissioned Blessington eGreenway Flood Risk Assessment document, 

"The flood period operation begins when the conditions require spilling of excessive flood waters until normal operating conditions are re-established. This flood period operation occurs when the Poulaphouca Reservoir level is greater than 186.30mOD Poolbeg (183.6mOD Malin)"

Water level is well below this and has plateaued over the last 6 days, with water inflow equal to water outflow. This July report from the ESB details how the lake acted as a buffer and managed heavy rain during the early part of 2026. Without the lake to moderate flow, huge amounts of flooding in towns downstream would be possible. 

Graph courtesy ESB website. 

Thursday, September 03, 2026

Reduction in Rate of Water Level Decrease in Poulaphouca

Graph of water levels
Water level in the Poulaphouca Reservoir
Image courtesy ESB

The water level in the Poulaphouca Reservoir is still dropping, albeit at a slower weekly average than a month ago, when it was falling by about 2 cm to 2.5 cm per day.

Saturday, August 15, 2026

"Flood" on the River?

Grove of flow versus tiem
Flow versus time for Golden Falls dam
Image courtesy ESB hydro
Does anyone know whether the ESB are generating from the Golden Falls power station? Forecasted flow has been 3 m³/s for the last week or two. However actual flow is tabulated at 2 m³/s.

Friday, August 07, 2026

How Fast Is the Level Dropping in the Poulaphouca Reservoir?

A lake shoreline, bordered with trees, viewed from behind a large, silhouetted tree

Poulaphouca lakeside
© Eugene Brennan 

A question was asked on the Blessington Blog today to the effect, “Will the lake get as low as this again over the next weeks?” It showed a photo of the Poulaphouca Reservoir taken during a previous drought, in which neat linear piles of rocks could be seen along the shoreline, clearly marking the locations of the walls of houses that were submerged when the valley was flooded in the 1940s.

Wednesday, February 18, 2026

Another Few Stats on Poulaphouca Reservoir Water Levels and Volume

Ash tree growing beside a lake
An ash tree growing on a trail beside the Poulaphouca Reservoir. © Eugene Brennan
In the period from 20th to 30th January, inclusive, the volume of water in the Poulaphouca Reservoir increased by 46 million m³ of water, corresponding to a 2.3 m rise in level. In the same period, discharges from Golden Falls dam totalled 16 million m³ approximately. Since the level in the Golden Falls lake didn't change appreciably over those 12 days, and its surface area is much smaller than that of the Poulaphouca lake, the amount of water that flowed into Poulaphouca must have been equal to the increase in volume plus the amount that flowed out — 62 million m³. Over the 12 days, that gives an average inflow rate of 62/12 million or approximately 5.2 million m³/day. That's about 1.5 times the flow rate through Kilcullen over a week ago. The Poulaphouca lake is fed by two rivers: The River Liffey and Kings River and so that's understandable. Some small streams also add to the water accumulated.
The ash tree above is on a nice section of path along the lake that leads to the car park on the N81, near the turn for Ballymore Eustace .
Stats are available on the hydrometric page of the ESB website here.
 

Tuesday, February 17, 2026

Making a Bit Of Space : Golden Falls Lake Level Has Risen

Water level in Golden Falls Lake
Water level in Golden Falls Lake, Ballymore Eustace. Image courtesy ESB hydrometrics

The Golden Falls lake rose 1.44 m since yesterday. That's a bit of a jump since the downwards trend over the last week or so, and equivalent to approximately 370,000 cubic metres (m³) of water. The Golden Falls lake doesn't really provide a large storage capacity compared to the much larger Poulaphouca Reservoir, which has a surface area of approximately 20 square kilometres (km²), 76 times that of the Golden Falls lake. According to Esbarchives.ie, the head of the Golden Falls dam is 17.4 m. If the walls of the 256,000 m² lake were vertical, that would give a storage capacity of about 4.4 million m³ of water. To put that into perspective, if it were empty, it could store only about a day and a quarter's worth of the water that passed through Kilcullen at peak discharge last week. So dropping the level isn't a huge advantage as regards overall storage and I guess the objective is to try and make more "headroom" available in the Poulaphouca Reservoir to cater for extended periods of heavy rain.

Image courtesy ESB hydrometrics.


Saturday, January 31, 2026

Press Release From the ESB About Potential Releases From the Poulaphouca Reservoir

A lake with bulrushes in the foreground
Poulaphouca Lake. © Eugene Brennan

Water isn't released directly into the River Liffey south of Ballymore Eustace from the Poulaphouca reservoir — it's discharged indirectly from the Poulaphouca dam into a compensation lake in Ballymore. This acts as a buffer, protecting the river downstream of the Golden Falls dam from huge surges and flooding. Although it's not related to surges on the river, a surge tank adjacent to the Liffey bridge over the gorge on the N81 protects the pipes, or penstocks, that deliver water to the turbines in the generating house from hydraulic shock.

The compensation lake also creates a pressure head for the Golden Falls hydro station as well as providing an amenity for fishing and water skiing. "The Flood" on the River Liffey is caused when water is discharged from this lake through the Golden Falls dam. The Poulaphouca reservoir has been acting a buffer up until now, holding large quantities of water from recent rainfall. The lake is fed by both the River Liffey and Kings River, in addition to some minor streams. However, water levels have increased by almost 2 metres, requiring water to be released. Since the Golden Falls lake is also almost full, this means that large quantities water must also be released from the Golden Falls dam into the Liffey at Ballymore Eustace to allow room for water being discharged from the Poulaphouca lake.

In a recent press release by the ESB, quantities haven't been specified and they say "there may be a need to pass through some of these additional inflows over the coming days."

Flows haven't been higher than 33 m³/s (cubic metres per second) in recent years. However, according to the Kilcullen Diary, they were at 55 m³/s in 2000 when a controlled, 24-hour discharge was necessary. This caused flooding in Kilcullen and other regions downstream.

Forecasted flow for the day, with values at 00:00, 08:00, 18:00 and 24:00 from the Golden Falls dam is available here on the ESB hydrometric page. 

A hydroelectric dam
Golden Falls dam. © Eugene Brennan


Thursday, December 18, 2025

Let's Do Some Calculations: How Much Water?

Roman arch bridge with water flowing under it.
© Eugene Brennan
I know I'm getting nerdy about this and becoming somewhat obsessed, but let's do some calculations for the total amount of water which has been flowing through the town per day.

Releases of water from Golden Falls dam in Ballymore Eustace have been unusually high over the last week. Some of this water will have flowed through the penstocks (large diameter pipes) to power the alternator and generate electricity. If power from the hydroelectric station can't be accepted by the grid and water level is too high in the lake supplying the dam, it has to "overflow". Large volumes of water are released through "doors" known as sluices, which are raised by electric motors. It then flows down concrete spillways into the river. Normally however, water is released through compensation valves in the dam. These allow a finer control of water flow.

Saturday, November 01, 2025

Kilcullen Mill Stream Rerouted

Mill stream, Kilcullen. Image courtesy Tailte Éireann.
I'm always trying to spot things I've missed on the Ordnance Survey Ireland (now Tailte Éireann) historical maps. One thing I hadn't noticed previously was that the mill stream was rerouted, sometime after 1939. The first image is a satellite photo and the next three, from top to bottom are the c. 1837 6" first edition map., the c. 1900 25" map and the last edition 6" map (which is post-1939, since the Nicholastown housing estate has been built, but pre-1950 because the Logstown estate hasn't been built yet).

On the last edition map, the area around the mill stream is marked as "liable to floods". I'm guessing the meander was removed from the stream and water routed through a deeper channel directly to the river to prevent flooding. (The channel could have been widened also). The original stream bed can be faintly made out in the satellite photo.
Maybe some older locals would know something about this?
 
The Irish Townland and Historical Maps Viewer can be accessed here:
 
Images courtesy Tailte Éireann.
 
c. 1837 6" first edition map. Images courtesy Tailte Éireann.

c. 1900 25" map. Image courtesy Tailte Éireann.

Last edition 6" map. Image courtesy Tailte Éireann.

Tuesday, July 15, 2025

Golden Brown in Laois: Investigating the Barrow Way

A corn field
© Eugene Brennan

My second long cycle of the year was an 80 km / 50 mile loop on Sunday that took in a section of the Barrow Way. This is a walking and cycling trail along the Barrow Branch of the Grand Canal and River Barrow that stretches a distance of 117 km, from Robertstown in County Kildare, to St. Mullins in County Carlow. My cycling route was cross-country to Athy via Narraghmore Bog, Mullaghmast and the new N78. Then along the Barrow Way from Athy to Vicarstown and back home via Kilberry Bog, the outskirts of Suncroft and Ballysax. Grit trails have been laid along the canal banks in the last decade or so to make cycling and walking easier.

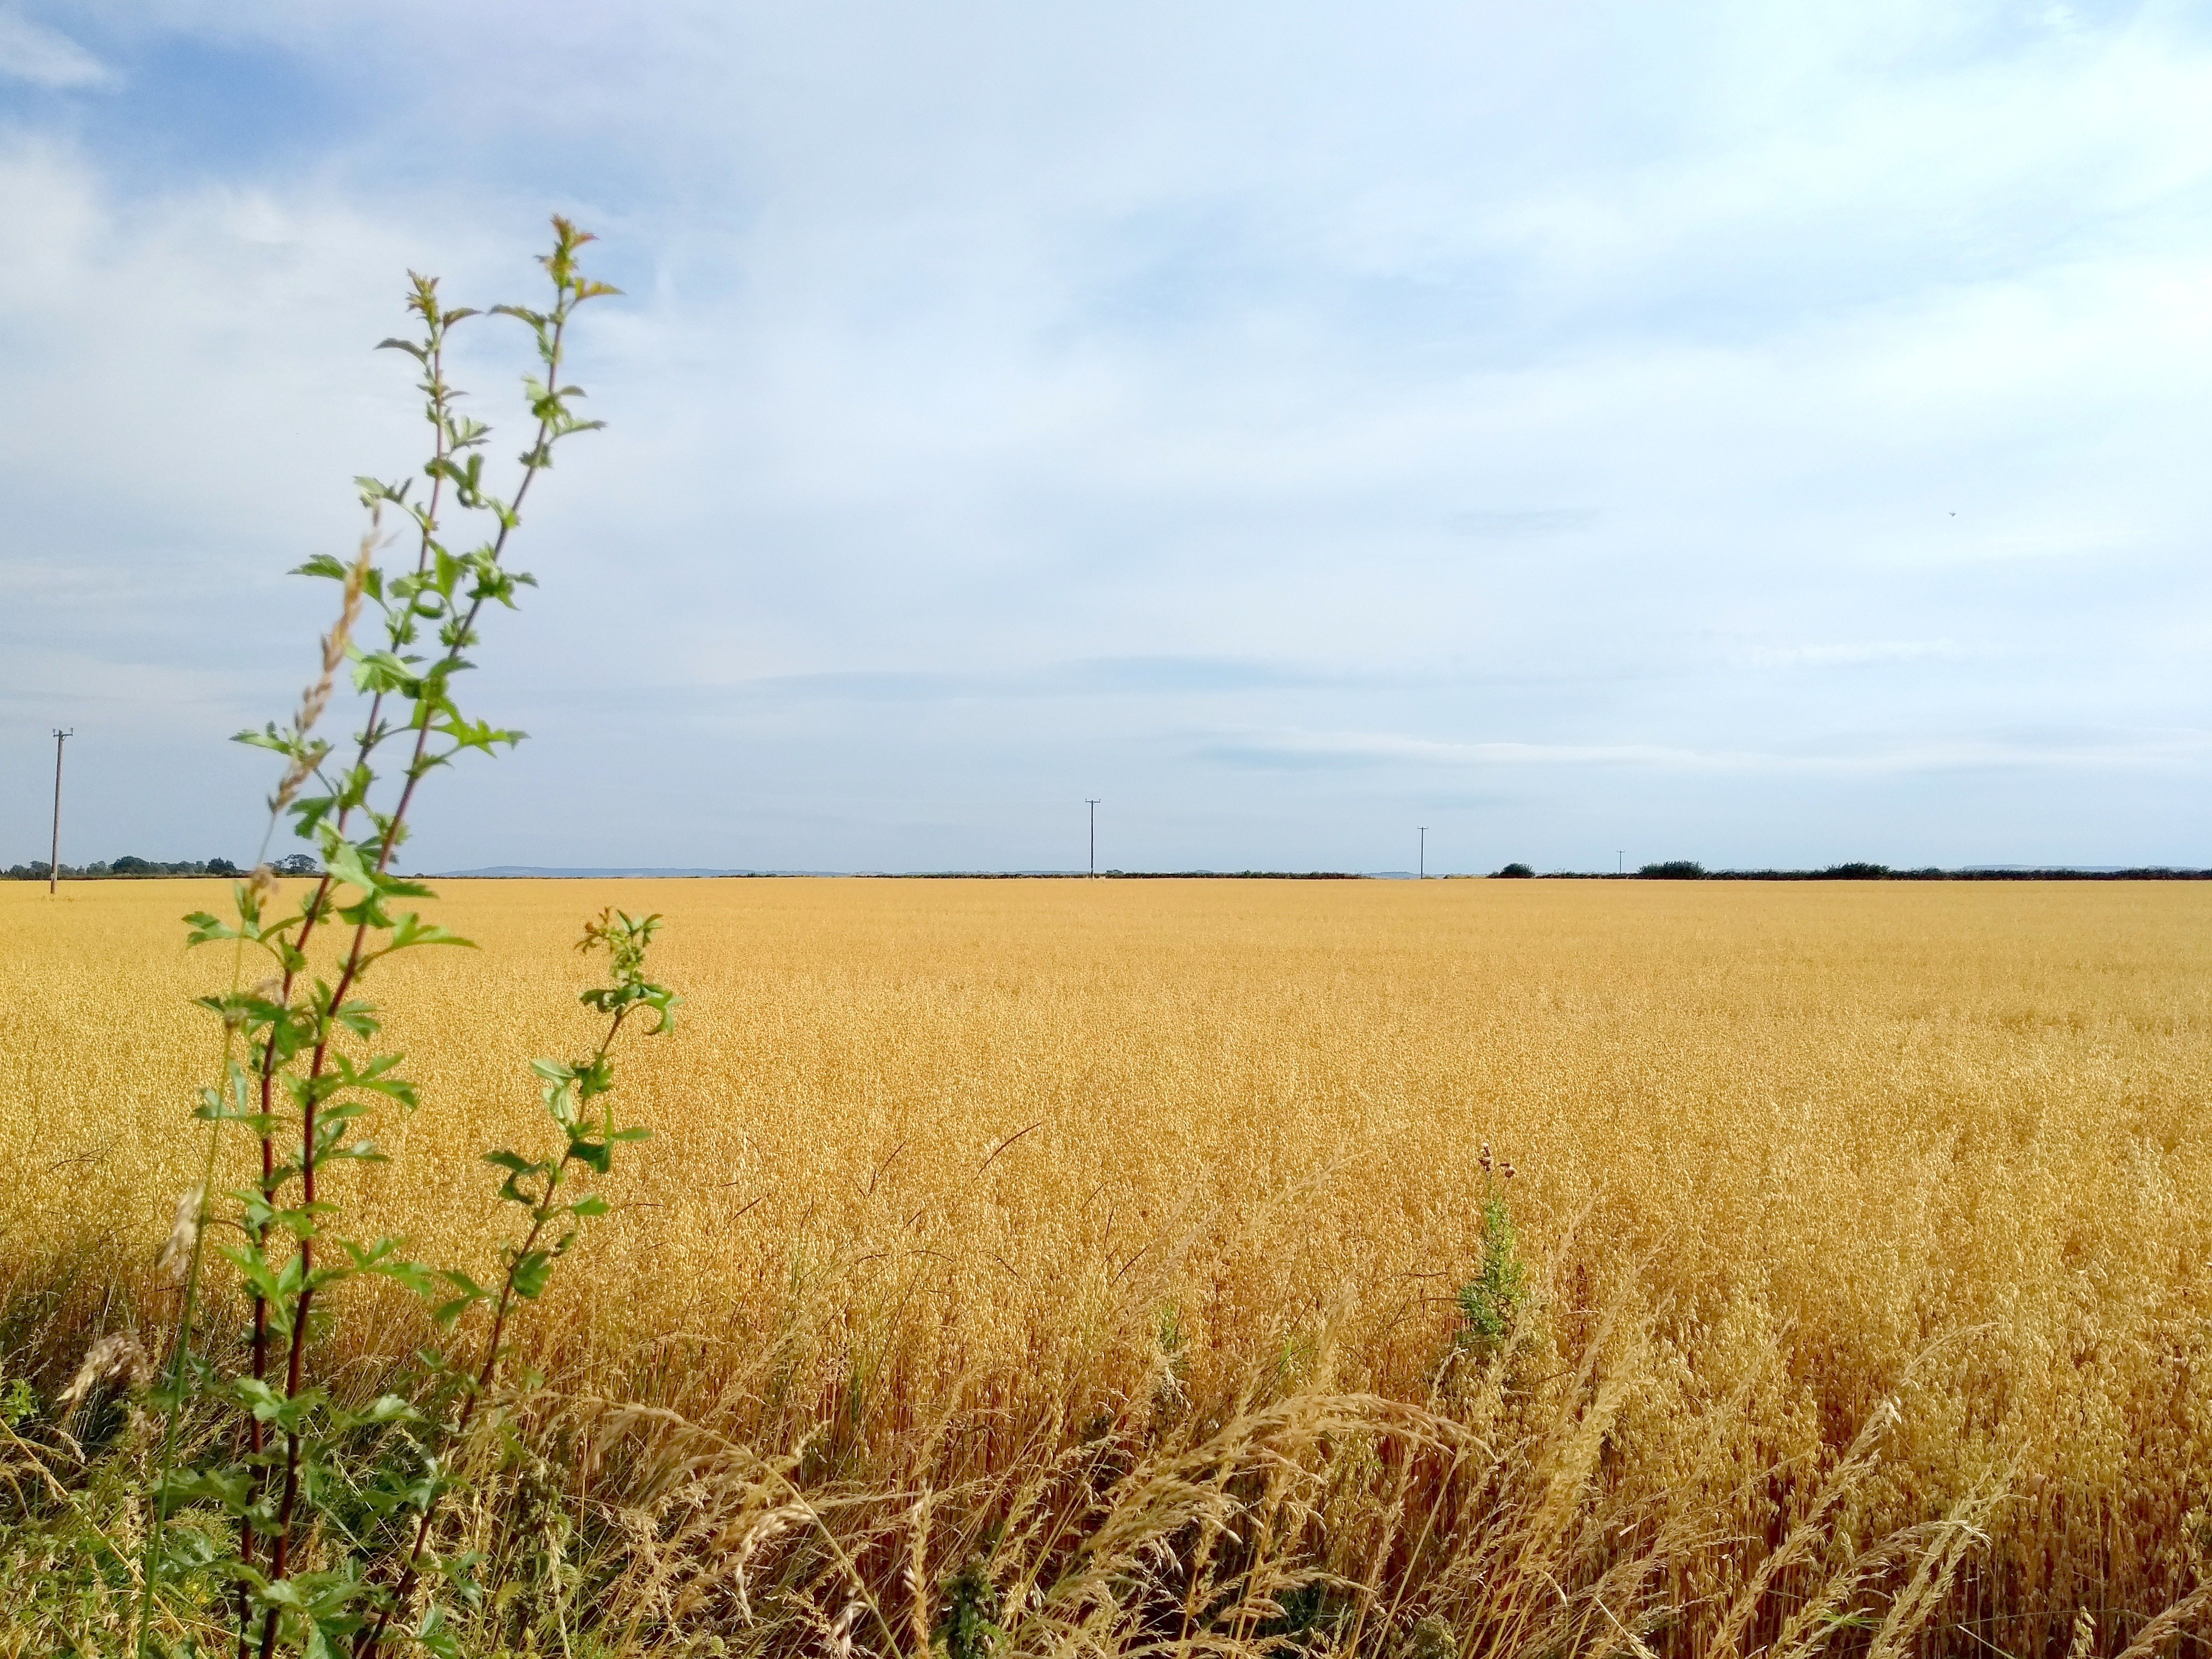
Kildare is a flat county, but the region of south Kildare and County Laois near Athy is characterised by exceptionally large, flat, open fields, almost prairie-like, cultivated with barley in the summer. The golden brown of the corn contrasts with the "big skies" and unobstructed views of the horizon.

Landscape of a corn field and sky
© Eugene Brennan

Apart from admiring the scenery along the Barrow Way, I spotted some interesting engineering features. The first was the Camac Aqueduct at Derrybrock in County Laois. This is a three-arched aqueduct, built over the Stradbally River in 1790, to carry the Barrow Branch of the Grand Canal. As far as I know, marl, a soft grey clay, found at the bottom of bogs, was used as a sealer for waterproofing the masonry joints of aqueducts. In the documentary series Hands, marl was also used by one of the operators of Powers Foundry in New Ross for lining the furnace to prevent the casing from being burned by the intense heat. The Camac Aqueduct seemed "leaky", water dribbling from the top of the arches. Maybe this is normal for these structures.

An aqueduct over a stream
Camac Aqueduct in County Laois. © Eugene Brennan

At Derrybrock Bridge near Vicarstown, I came across an OPW hydrometric measuring station, similar to the Kildare County Council owned and EPA managed one at the Mill Stream bridge on the Mass Path in Kilcullen. While the monitoring apparatus in Kilcullen is somewhat low-key and wouldn't be noticed by the casual walker, the station at Derrybrock is more obvious. A large, and what appears to be a broad-crested, flat-V weir, similar to the one in Kilcullen is used to backup the water so that it rises in level.  The monitoring equipment, powered by a solar panel, projects out of the side of the riverbank. The "V" in this weir is more obvious than the one in Kilcullen, with the arms of the "V" rising up out of the water on both sides.  Various types of profiles are used for weirs: rectangular, parabolic, trapezoidal, flat-V and V-notch, each having their advantages and disadvantages. Flat-v weirs are used for measurements in rivers and streams with low flow rates and narrow stream beds. Some info on the different types and flow calculations here. As I explained in the article about the Mill Stream hydrometric station in Kilcullen, weirs are used for measuring water flow. A weir causes water in a stream or river to backup and rise in level. By measuring the level using an ultrasonic or pressure transducer and doing some calculations, flow rate can be worked out. This hydrometric data can then be used for planning, water management, flood research etc. Information on the EPA's hydrometric programme is available here. It's part of the National Hydrometric Programme, with other bodies such as the OPW, the ESB and Waterways Ireland also involved in measuring water level and flow. Data from a network of over 1000 hydrometric stations around the country can be viewed on the EPA's Hydronet website.

A shallow-crested v-weir in a stream
Derrybrock Hydrometric Station. © Eugene Brennan

Hydrometric water measurement station
Instrumentation for measuring water level. © Eugene Brennan

A shallow-crested v-weir in a stream
Flat-V weir. © Eugene Brennan

A shallow-crested v-weir in a stream
Flat-V weir. © Eugene Brennan

A hydrometric measuring station beside a stream
Weir view from Derrybrock Bridge. © Eugene Brennan

Saturday, May 24, 2025

Poulaphouca Water Levels

© Eugene Brennan

This time last year, level was 185.5 m above the datum. Now it's 185 m after having dropped to 184 m in January. Water level increased by nearly a metre in February, either due to no releases or heavy rainfall which caused a net increase. Data on Poulaphouca releases no longer appears to be available.
The "tide" was out yesterday and I managed to make my way by bike from the car park near the turn for Ballymore, around the edge of the lake to pick up the greenway. This isn't always possible because sometimes the water is too close to shore.
Tree beside a lake
© Eugene Brennan

Edge of a lake and strand, with tree branches in the foreground
© Eugene Brennan

shore of a lake with trees in the background
© Eugene Brennan

shore of a lake with trees in the background
© Eugene Brennan

Thursday, May 15, 2025

Engineering Case Study: Weir Calibration at Mill Stream Bridge

Michael Browne from the EPA makes some calibration adjustments at the hydrometric station on the Mill Stream, Kilcullen, Co. Kildare. © Eugene Brennan

If you’ve ever taken a shortcut through the fields to New Abbey graveyard in Kilcullen, you may have noticed a silver-coloured tube beside the bridge where the mass path crosses over the mill stream. There’s also an adjacent vertical scale with numbers on it, rising up out of the stream. This setup is one of over 800 active hydrometric stations located around the country that collect water flow and level data as part of the EPA's National Hydrometric Programme. The stations monitor both surface water (streams and rivers) and groundwater, providing valuable statistics on water movement. The data is used for managing water resources, infrastructure design and monitoring long-term trends for flooding.
The mill stream station was commissioned in October 1999, but only started recording digitally in 2009. Originally a mechanical chart recorder would have been used to record data with a pen on a roll of paper. The recorder would have been driven by a weight, similar to the one in a grandfather clock. This recorder would have been housed inside the stilling chamber if used, although it's more likely that a digital data logger was used at this station from when recordings began in 2009.

What’s a stilling chamber?

This is the metal tube beside the bridge. It shelters the water’s surface, making it less turbulent, ensuring more accurate stream level measurements.

How do hydrometric weirs work?

These structures are used in hydrometrics to measure flow. They can be rectangular, V-notch, broad-crested etc, typically made from concrete or stainless steel sheets. The type used under the mill stream bridge is a concrete flat-V type. A weir causes water to backup behind it and change in level as flow rate varies. Using an equation specific to the shape of the weir, the flow rate can be determined from the water height. In theory, flow rate can be calculated knowing the cross-sectional area of flowing water and measuring its velocity. However, velocity varies within the flow; faster in the middle of a stream and slower towards the edges and bottom due to drag. Therefore, making a velocity measurement at a single point in the flow would be insufficient. Using a weir simplifies the calculations.
Various types of weirs have been studied and empirical equations developed (i.e. by making measurement from models, not analytical derivations) giving flow rate versus water level. Water level can measured using an ultrasonic transducer that emits a high-frequency sound beam and detects its echo. By knowing the transit time of the beam and the speed of sound, distance can be measured to the water surface (similar to the way an ultrasonic measuring tape works). This measurement is then converted to a flow reading, using an equation specific to the type of weir. Alternatively a depth sensor can be used to measure water height.

Telemetry

Measurements are taken every 15 minutes and telemetry data is transmitted every four hours via a GSM modem back to a central station. Although instrumentation can be powered by a solar panel or a small windmill, this station is powered by a battery. To conserve battery power, a compromise has to be made on measurement intervals, and on-time needs to be minimised: the instrumentation wakes briefly, takes a reading and then returns to sleep.

Stilling chamber containing a depth sensor for measuring water level at the Mill Stream hydrometric station, Kilcullen. Co. Kildare. © Eugene Brennan

Calibration of the Weir at the Mill Stream

I met Michael Browne from the EPA a couple of months ago on a walk through the fields to New Abbey graveyard. I was immediately curious, having worked for a company that had designed, manufactured and installed data logging equipment for local authority sewage and water treatment plants. I got chatting with Michael and discovered he was calibrating the weir. This is done every 6 to 8 weeks or so to make sure readings are correct on an ongoing basis. Vegetation can build up on the weir, causing errors in measurement and so it has to be cleaned. Calibrating the weir involves taking actual flow measurements using a portable flow meter and making corresponding readings for the height of water. Necessary adjustments are then made in the instrumentation firmware (embedded software) to the equation that converts height to flow.
I could have talked shop to Michael all day, but I didn't want to take him away too long from his work. Also the cattle had become curious and had come from both fields to investigate, so the place was getting overly crowded and it was time to move on.…
 

An antenna is mounted on top of the stilling chamber for sending data back to a monitoring station. © Eugene Brennan
Archer 2, handheld computer used for calibrating the system. © Eugene Brennan

Thursday, December 12, 2024

Mill Stream Gauging Station

© Eugene Brennan

Some more technical information here on the gauging station at the bridge over the Mill Stream on the Mass path. The station measures water level and flow rate. It was constructed in 1999. The weir on the downstream side of the bridge is a flat-V type, not rectangular as I suggested in an earlier post. These structures are used in hydrometrics for measuring flow. They can be rectangular, V-notch, broad-crested etc. The idea of a weir is to cause water to backup behind it and change in level. By measuring the level of water above the base of the weir, flow rate can be calculated. In theory, flow rate can be calculated knowing the cross sectional area of flowing water and measuring its velocity. Simply multiplying the two parameters together gives flow rate. So for instance if a stream is 2 m wide and 1 m deep, and water flows at 1.5 m/s, flow rate is 2 x 1 x 1.5 = 3 cubic metres per second. However, this would still require water level to be measured because it varies depending on whether there's high or low flow. More significantly however, velocity varies within the flow. (Fast in the middle of a stream and slower towards the edges and bottom because of drag). So making a velocity measurement at one point would be inadequate. Using a weir simplifies the calculations. Various types of weirs have been studied and empirical equations worked out (i.e. by making measurement from models, not worked out analytically) giving flow rate versus water level. Level is usually measured using an ultrasonic transducer that sends out a sound beam and detects an echo. Knowing the transit time of the beam and the speed of sound, distance can be measured to the water surface, which is then converted to a level measurement (similar to the way an ultrasonic measuring tape works).

Sunday, December 08, 2024

The Mill Stream in 2015, Kinetic Energy and the EPA's National Hydrometric Programme

Flow wasn't quite as strong today, but it could be once all the rain from last night soaks through the ground and makes its way into watercourses. This video was from October 2015 after a long, wet autumn. The water level was up to the 4th rung from the top of the ladder (half a rung spacing lower today in the video at the end of this post). At some stage, I want to do back-of-envelope calculations to see what the max energy output would be if the stream was harnessed. Kinetic energy can be calculated simply by measuring width, depth and speed of the flow to get cubic metres per second and working from there. Surface speed could be checked by timing how long it takes something floating on the surface to pass between two points. Speed wouldn't be constant from surface to bottom of the flow or from centre to the banks because of friction, but the streambed under the bridge is smooth and level, as are the walls, so velocity profile is known for such shapes (This is effectively a rectangular weir, used by the EPA to do hydrometric measurement). 
 
Data for the "Kilcullen Stream" is available here on the EPA's HydroNet website. (Isn't this the "Mill Stream")? 
 
Data available on the EPA's HydoNet website. Image courtesy EPA.


What's the tube at the side of the bridge?


This is the stilling chamber of what's called a gauging station by the EPA. The stilling chamber is used to make the surface of water less turbulent so that stream level can be measured with an ultrasonic sensor (which needs a level surface to get a reliable echo for measuring distance). I'm not sure whether they actually use a logger here to measure levels continuously. There's no antenna for telemetry, so possibly data is downloaded every so often or more likely transmitted using a GSM modem over the mobile phone network. A Yuasa type battery would power a setup like this because the electronics only has to wake up every 15 minutes or so, take a measurement and then go to sleep again. (Similar to the way a wireless doorbell sounder only wakes up every second or so to detect a button push). There's also a scale at the station for taking manual depth measurements.

More information about the EPA's National Hydrometric Programme is available here.
 

 Mill Stream December 7th, 2024


×

Posts by Category